Uniquely compare your performance against the competition
Optimize your efficiencies and deliver needed patient treatment earlier
Our solutions provide invaluable insights that organizations can’t get from claims data alone. We enable you to respond and act within days, not weeks, of when an event takes place.
Our data sources go much deeper than claims data. We draw insights from payer dispense data, from healthcare providers, from ICD-10 codes, from pharmacy notes and much more.
This allows your team act quickly to engage a healthcare provider and deliver a compliant, resonant message on behalf of your brand.
In today’s competitive market place timing is everything. Leverage our competitive insights solution and be the first to know.
Features:
- Compare your brand performance to the competition, see discontinuation and other issues on competitors
- Compare your HUB performance fill rates and time to fill to other similar programs
- Get daily alerts for when and why a patient will drop another brand
- Get a level of detail beyond claims data with HCP level data, IDC10 codes, pharmacy notes, and more
Benefits:
- Establish baseline performance goals to reality
- Refine GTM strategies to optimize your brand adoption
- Identify and address opportunities to improve fill rates and reduce time to fill
- Engage with HCP providers sooner and deliver a compliant message that resonates
switch Rx rate by
30%
your ability to get
more patients
on brand
hub performance efficiency
by up to
20%
Brand Benchmarking
We can help you answer the following:
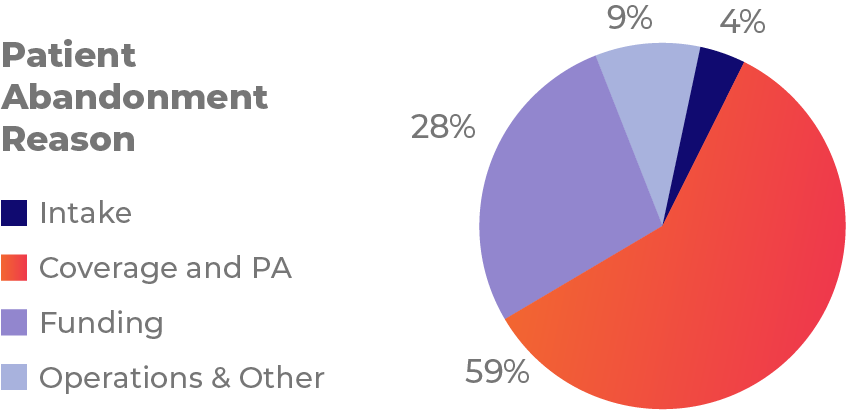
- What are the biggest drivers of abandonment for your brand?
- How do access barriers compare between your brand and others?
- What can you do to help patients start and stay on treatment?

Our dynamic platform provides quick and easy access to data. Compare your brand performance against others in the market – and drill down into the “why” – to develop strategies that optimize your success.

Patient Services Performance Benchmarking
Our solution enables you to compare your brand’s performance metrics with benchmark data we have gathered to identify issues and give you a sense of what good looks like.
We can tailor our analytics to help you explore a variety of metrics, including understanding the impact that physician experience and product maturity may have on first-paid shipments over time. With Claritas Rx, you’ll have the insights to benchmark partner performance.
Market Alerts
Be the first to know when and why a patient drops ANOTHER brand. With Claritas Rx, your team can identify patients that stopped treatment of another brand within DAYS of when they fell off, NOT WEEKS or MONTHS.
You’ll know when a patient drops and why, so your team can compliantly engage prescribers on treatment options ahead of your competition. Our machine-learning algorithms, advanced analytics, and integrated platform help you develop commercial strategies to engage HCPs earlier and drive your brand adoption.


Rich Daily Data Makes a Difference
Lots of companies use claims data as the foundation for their competitive insights. Although this has value, it offers a very narrow view with many blind spots of the patient treatment journey – and it’s typically weeks old by the time you receive it.
Claritas Rx is different; we access rich data sets daily from Specialty Pharmacy and Hub partners to piece together the entire patient treatment journey. With Claritas Rx, you can access up-to-date information that gives you a clearer picture of the patient’s status throughout their journey so you can act sooner.
Faster, more timely engagement

Find Rx switch opportunities faster with rapid market alerts and competitive insights

Enable timelier HCP engagement within 1-2 days

Discover when and why patients abandon Rxs and drop off treatment
Deeper, richer benchmarking

See switching opportunities in near real-time

Measure core KPIs such as fill rate

Identify and compare access barriers for new patients


