Claritas Rx Ascend Patient Access Analytics Platform
Enlighten and inform your team
Deliver patient performance analytics and actionable insights tailored to your brand requirements.
Supporting a specialty pharmaceutical brand and accessing appropriate datasets to optimize your business is challenging. Claritas Rx works with you and your team to ensure that real-time patient performance and access analytics deliver actionable insights tailored to your brand requirements.
Claritas Rx Ascend’s market access analytics capabilities draw from years of experience in specialty pharmaceutical analytics. We deliver clear, timely insights into patient experiences across the treatment journey allowing you to assess how well your programs are performing in real time.
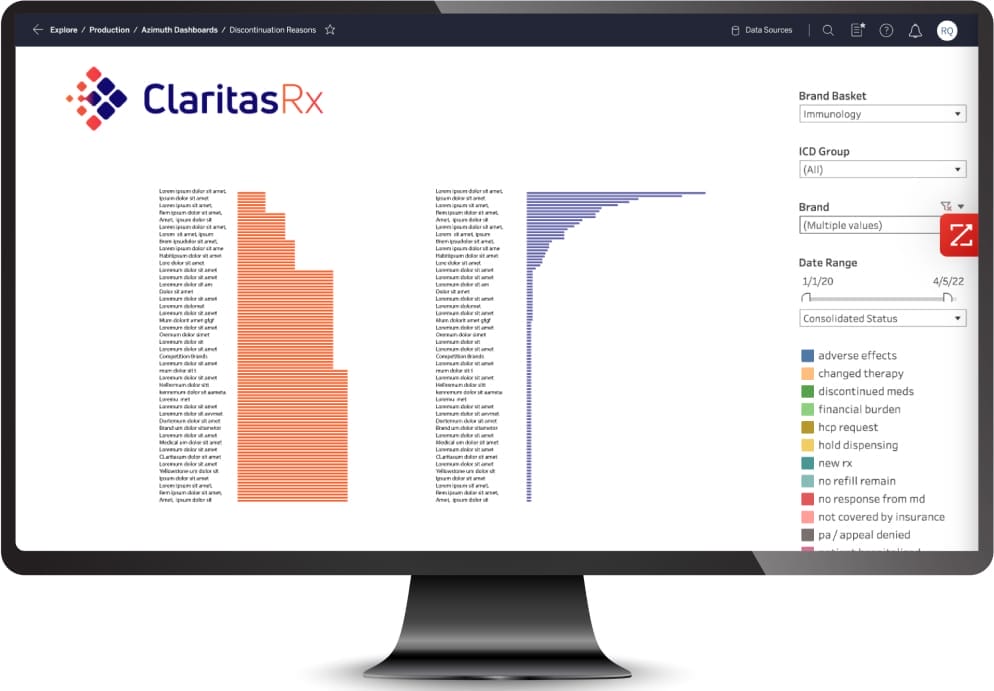
Learn more about how our patient access analytics services deliver performance analytics you can rely on.
Access Analytics Platform That Drives Actionable Insights
Comprehensive Patient Access View
Claritas Rx’s access analytics provide a clear view of the patient engagement journey to the market access team. The platform allows these teams to track SP and HUB enrollment, patient starts, approvals, abandonment rates, and co-pay support—all in one place. Additionally, making data-driven, informed decisions is easy with automated reporting for shipments and insights on card activation, penetration, and payer profiles.
Actionable Market Access Data
Claritas Rx simplifies the monitoring of patient experiences to optimize outcomes. Market Access teams can quickly identify ways to remove barriers and improve efficiency by tracking services, activity, and inventory. Automated, advanced analytics help develop payer strategies and deliver actionable insights, empowering market access teams to respond swiftly and support patient needs effectively.
Claritas Rx
as an extension
to your team
performance analytics
you can rely on
Channel Insights
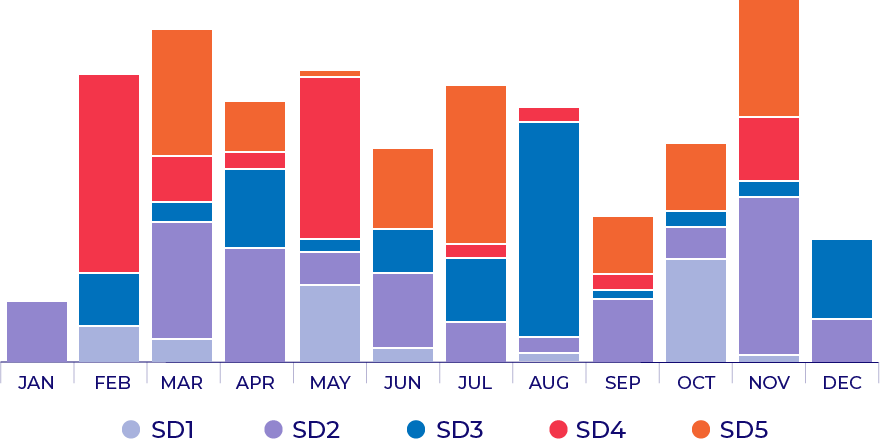
Our platform offers channel insights. These include distribution by channel, SP, SD, and total shipments from HUB. We also provide distribution by diagnosis, on-time shipments, 3PL returns, and replenishment rates. These reports allow your team to leverage data and analytics to better focus resources and improve performance.
Trade and Contracting
Claritas Rx has developed a set of specific trade and contract reports to enable you to view and compare GPO and non-GPO volume and financial metrics. Access to this monthly and quarterly data helps you understand the effectiveness of your programs.

Patient Services Insights
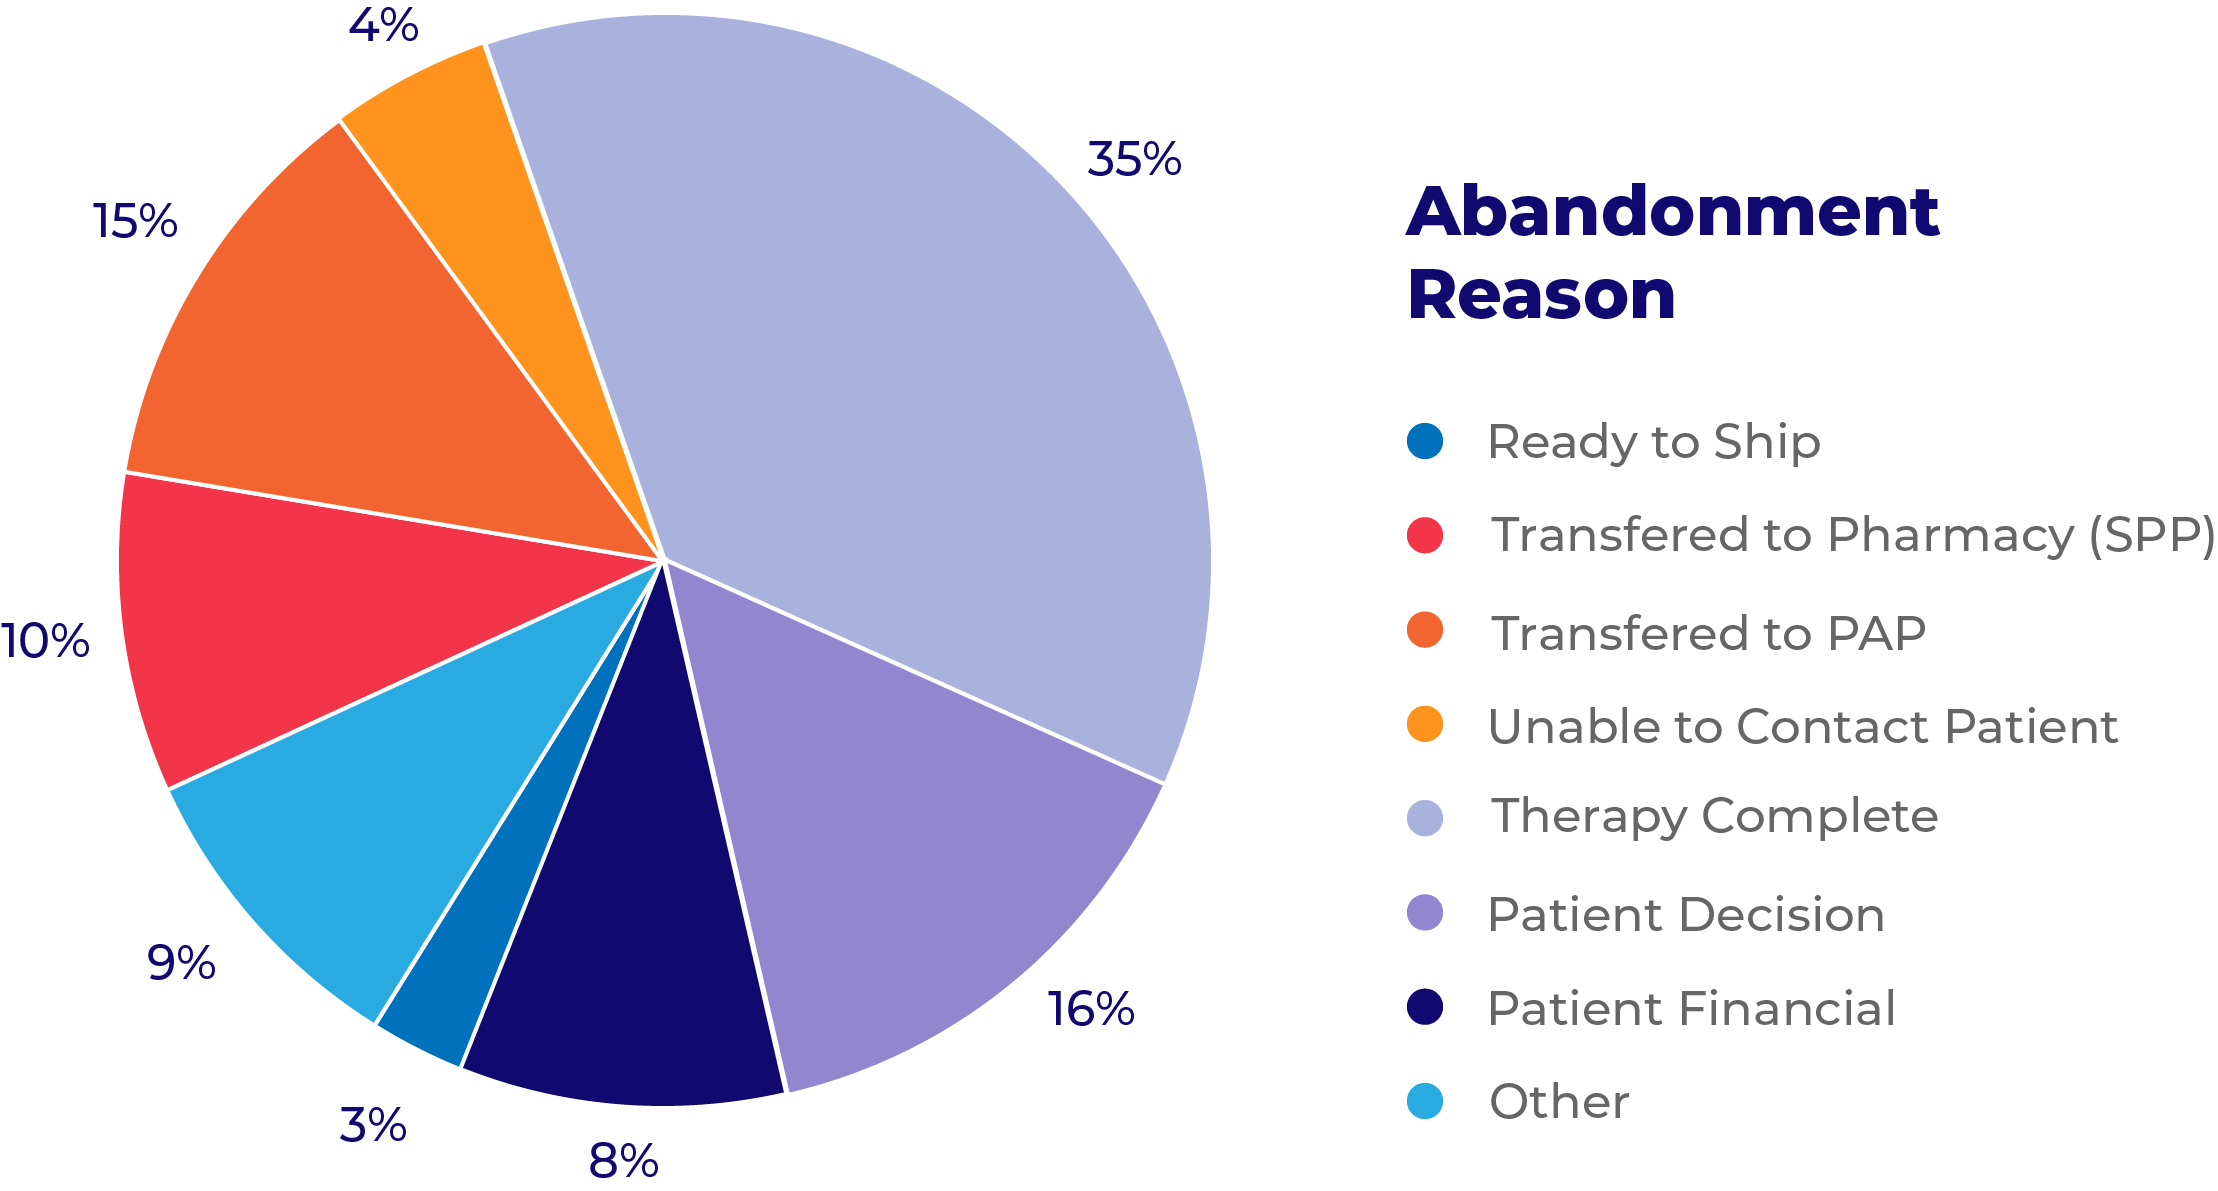
Our access analytics solution offers many dashboards and reports. These tools help your Patient Services team understand data volume better, giving visibility into the data behind enrollments, referrals, cancellations, and discontinuation rates. Use these insights to better understand performance and identify areas for improvement.
We also offer a series of reports around co-pay metrics. These reports can help you understand co-pays relating to enrollment, redemptions, average pay per patient, and overall card penetration so you can gauge re-reimbursement effectiveness.
Moreover, we can help you review your patient clinical support needs by providing nursing call metrics such as volume, capacity, and overall performance.
Payer Insights
Claritas Rx provides reports to help your team develop the right pricing and rebate strategies, using the latest metrics and analytical tools.
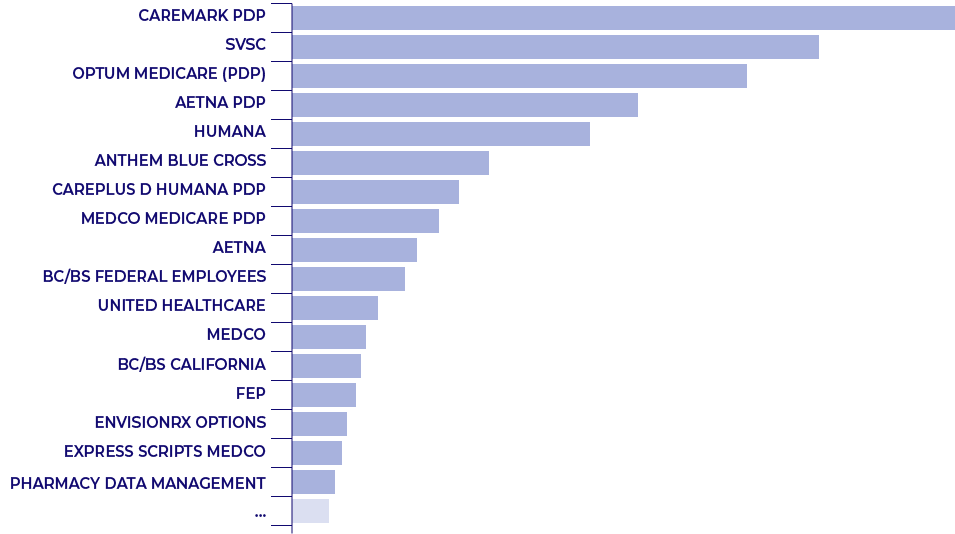
Our reports pivot around primary payer types for payer mix, total enrollment, new starts, approval rates, fulfillment rates, turnaround times, and denial reasons so your payer team can improve their overall payer strategies.
Visibility for meaningful action

Monitor the patient experience across the treatment journey

Track patient services activity and co-pay support

Manage and optimize inventory to improve efficiency
Tailored daily performance views

Tailored daily performance analytics you can rely on

Understand how to drive impactful payer market strategies

Automate market access, payer, and channel insights reporting


